Urban Data Analytics: (3) Showcase - Noise 311 Research
- Jan 24, 2018
- 2 min read
Updated: Feb 11, 2018
Many of the social and environmental phenomena have spatial characteristics. Geo-spatial methods, such as, maps, GIS, and etc, are excellent ways to visualize and understand these characteristics. In this page, I will introduce some of the urban analytics and geospatial modelling techniques that I use frequently. Below I showcase one of the projects, called "Noise 311 Research" that leverages the power of spatial analytics, web mapping, and geo-visualization.
One of the tools I frequently use is Leaflet.js. It is a javascript-based web mapping engine that allows for creating a web map with a breeze. Using the Leaflet.js, I created a dot density map and hex map of noise complaints from Vancouver's public 3-1-1 call data in 2016.
Temporal patterns
With this initial exploration, I explored temporal patterns of noise complaints and major development projects by year. Major development projects are any projects with the estimated capital costs over $20 million CAD. The below graphs show that the total volume of both major development projects and noise complaints have been increasing. The graphs also show that these two data seem to be temporally related (Figure 1).

Figure 1: Temporal trends of major projects and noise complaints
Spatial Patterns over Time
For spatial patterns, I put together the noise complaints data for all years from 2010 to 2016. Then, I created a heatmap using a kernel density estimation (KDE) to show clustering patterns of the noise complaints in the City of Vancouver (Figure 2).

Figure 2: Spatiotemporal pattern of noise complaints
Next, I pulled geo-coded information of all the major development projects that exceed 20 million in capital costs from the Province of British Columbia. The data ranges from 2010 to 2016. With the same KDE approach as the noise complaints data, I created a heatmap of the major development projects in the City of Vancouver (Figure 3).
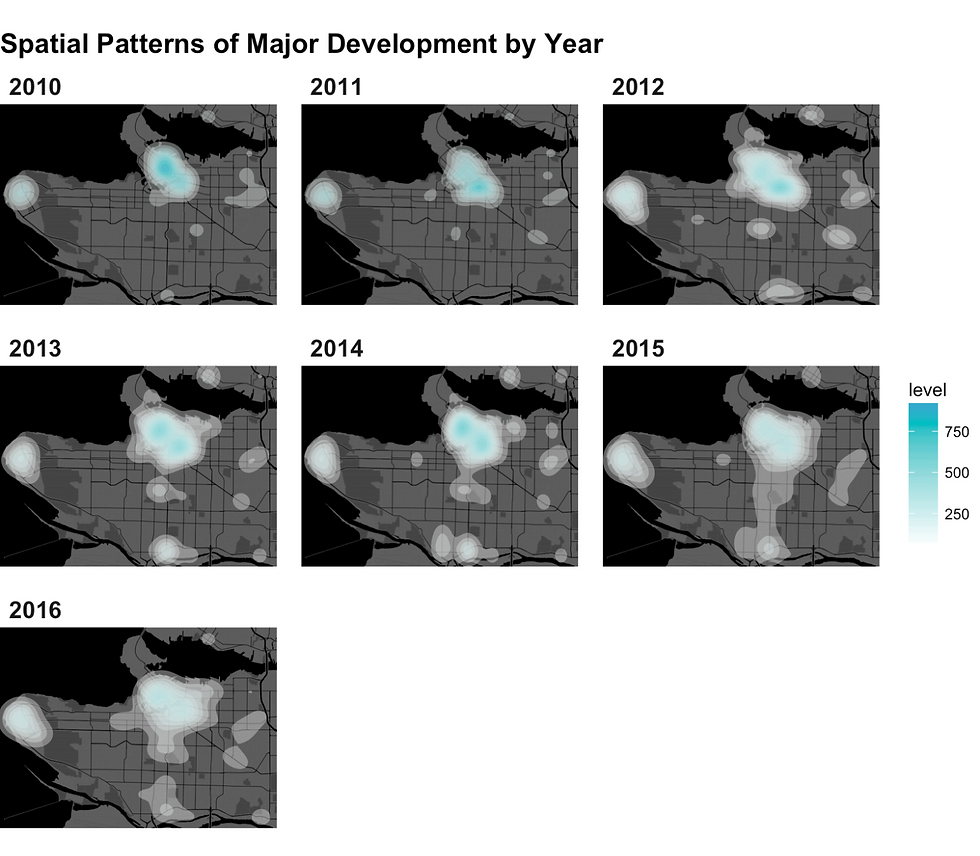
Figure 3: Spatiotemporal pattern of major development projects
Both heatmaps show general patterns of noise complaints and major development projects expanding toward southeast direction. Downtown shows the highest clustering patterns for both noise complaints and major development projects.
With these visualizations, I developed a mixed-effects Poisson model estimating the number of nose complaints as a function of the number of major development projects. The panel data required the model to be built using dissemination area as a random clustering factor. Later, I will present the model results and random effects diagnostics as I move forward with the analysis.
Comments